- About Auto Debug
- Quick start
- Detailed instructions
- Trace options
- Using debug symbols
- Call stack
- Multiple threads
- Parameter values
- Restarting a trace
- Loading symbols from a mapfile
- Remote tracing
- Other Features
- pdbfiles
- Script
- Use Script
- Script Information
- Script Functions
- Script Event
- addExtMapFile
- addMapFile
- addMenuItem
- attachProcess
- echo
- enableAllBreakpointOfDll
- enableBreakpoint
- getParamAddress
- getProcessMemory
- killProcess
- OnBreakPointEntry
- OnBreakPointReturn
- OnException
- OnProcessEnd
- Property
- saveLog
- setProcessMemory
- startProcess
Trace output
When the trace job is complete (and while it is still running as well) the window frame on the left will show the functions you have selected for tracing that have been called by the target program.
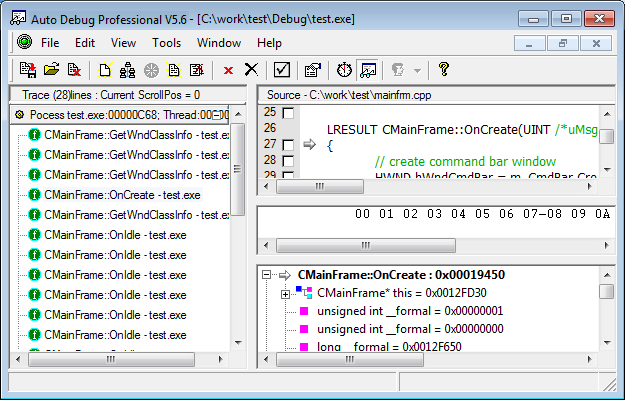
The functions shown in the trace window are arranged in the form of a tree - a hierarchy representing the
order in which the functions call each other. The call tree is collapsible: you can hide any subtree out of view and open it again by clicking on the (-) and (+) icons next to the collapsible nodes - that is, those functions that were seen to emit calls to other functions you have selected for tracing.
The absence of a (-) or (+) icon next to a node means it is a leaf node - it means the function it represents did not call any other functions selected for tracing.
When you click on a node in the call tree, the frames on the right will display all information about that call collected during tracing. This information includes:
In the top frame, the relevant source file (if available) and the function's location in it.
In the bottom frame, the function's definition (with varying levels of detail, depending on the available information), its return value, and two lists of arguments - with the values recorded before and after the call.
If you click on an argument or on the return value in the bottom frame, and if the value in it can be interpreted as a valid pointer, the dump of the corresponding memory area will be shown in the middle frame.